

Your High Engagement Users May Not Be From Where You Think They Are!
So often we hear advertisers making assumptions about their data or their target market. One big one we hear consistently is the answer to “what states do your ideal target market live in?”
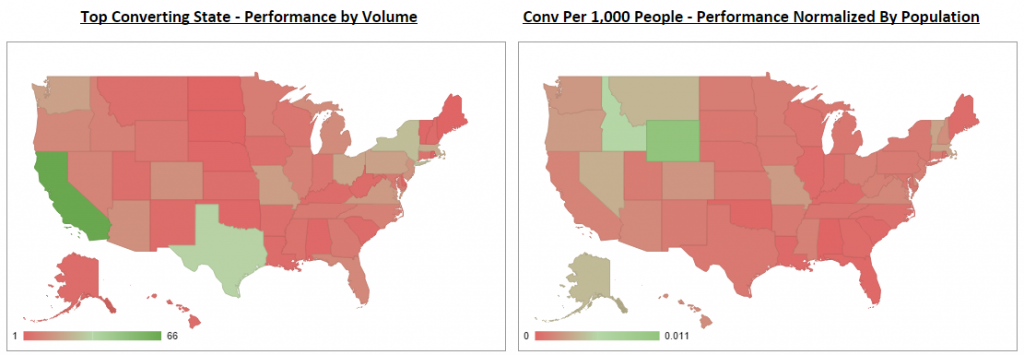
99.9% of the time the business owner will say all of or a combination of the following states: Texas, Florida, California, New York, Illinois.
To be fair, it’s not entirely false. We often focus on volume, which in business matters. If 40% of our revenue comes from these 5 high population states, then it’d be silly not to find way to focus there.
With that said, what if I told you that always looking at volume masks real gems hidden in your data and uncovering these could resulting in additional revenue without jacking up your PPC spend on highly competitive states?
What if I told you that you could and should drill down to spot these highly engaged users and boost your marketing to laser focus on these groups and squeeze all you can out of this high-value segment? What if I told you, we created a (free) tool for all this?
Get Your Free Download
Download your FREE copy of our state-level analysis spreadsheet to see which states are really driving your ROI.
How the State Performance Analyzer Works
In this free download you are able to do an easy “data dump” from AdWords and quickly see state-level performance.
Instead of just always looking at volume of cost and conversions, this view will show you the states after normalizing the data for the population size of each state, reducing the impact of skewed data. Basically showcasing the amount of conversion per 1,000 people in the state, bubbling up high engagement states.
Letting The Data Show Trends You Probably Already Suspect!
There will likely be an “oh duh” moment when you see the numbers. Here are some insights from our own clients worth sharing…
- An international travel operator’s target demographic are older, medium income, retirees interested in coach bus tours in Europe. The volume of traffic and leads may have come from CA, FL, NY, and TX, but when we layered the leads per 1,000 people in the state we saw a clear trends for Florida, New Hampshire, Maine, Vermont, and Pennsylvania, all of which just happens to be in the top 10 states with largest percentage of population over 65 years old according to WorldAtlas.com.
- A partner selling a bug protection product confirmed that FL and TX were indeed high performers in both volume and rev/cost (jackpot!) but also uncovered huge opportunity in some medium traffic but high-value users in GA, SC, and LA. These three has lower positions than the account average and we were able to increase our bid adjustments to be more aggressive in these high-need states.
Follow the following link to the State Performance Analyzer.
Notes About The Book
This book is a little more advanced and likely to be very helpful if you have some knowledge of Excel.
- There are four sheets:
- “How to Pull Data” – Make sure you are pulling the exact columns in the exact order!
- “Your Data” – This is where you will input the raw data
- “Summary” – This is an easy-to-view Sorted columns looking at the data in three ways: highest converting states, highest spending states, and highest rev per 1,000 people
- “Analyzing The Data” – Provides some recommendations how to look at the data and potential optimization you can make from it.
- Make a copy! The book is not editable, you must make a copy and download to your own Google Drive.
- Make sure you are looking at a long date range, not just last 30 days. If this is the first time you are making bid adjustments at the state level, pull 3 months to 12 months of data.
- If there is no conversion value data, no worries! Hide that column and just use the conv per 1,000 people column.
- Make sure to format the raw data as shown and remove unnecessary values:
- Total line
- Non-US States
- Unspecified
Like what you’ve read? What are you waiting for? Download your copy of our state-level analysis spreadsheet now!
Happy analyzing!